


Every month, ELSTAT announces a figure, and every month the same misconception is repeated. When inflation falls from 12% to 3%, prices do not fall — they simply rise more slowly. The difference between the two is the very distance that separates the economic bulletin from the supermarket checkout.
The white line is the price level. The cyan one is its rate of change — what we call inflation. Economists monitor the second; the consumer lives with the first.
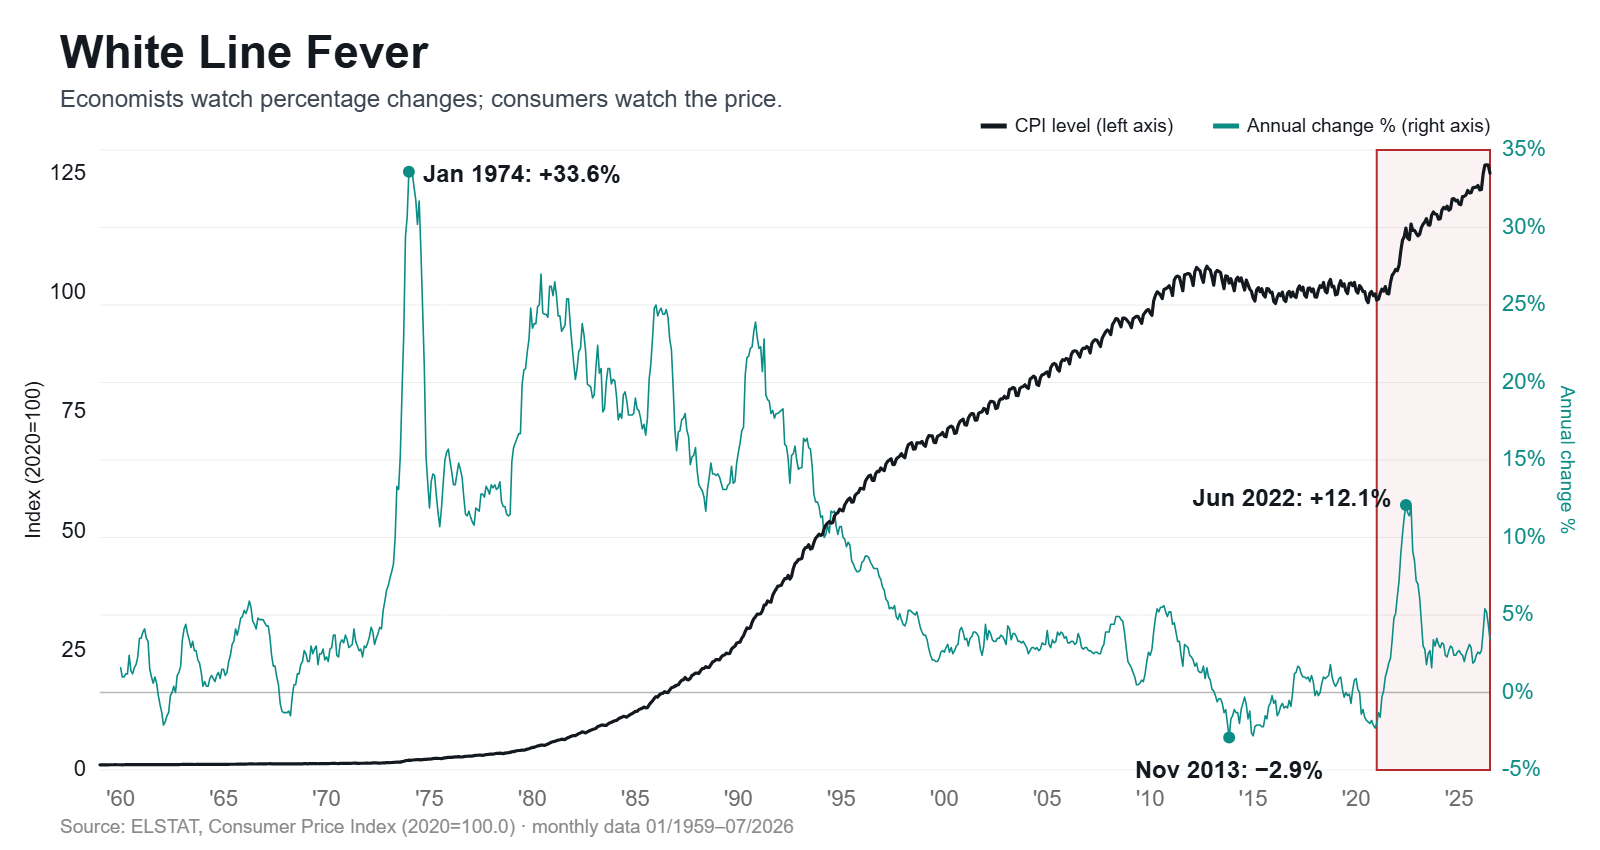
The blue line bobs up and down, turns to zero, and sometimes even drops below it. The white one almost never does. From January 1959 to July 2026, the price level in Greece multiplied 115 times. There is no point on the graph where the white line returns to a previous level and stays there.
The Consumer Price Index (CPI) has been compiled by ELSTAT since 1959 and measures the change in prices of a fixed "basket" of goods and services. The base year is currently 2020, which equals 100. The index for July 2026 stands at 125.1: the same basket that cost 100 euros in 2020 costs 125 today. Wherever a comparison with 2019 is mentioned below, it refers to the same series rescaled to January of that year — the last one before the pandemic.
Two clarifications that are often omitted. First, the CPI is a weighted average — the weights are derived from Household Budget Surveys and are updated annually. Second, your personal "basket" almost never coincides with the statistical one: a household that spends disproportionately on rent or fuel experiences a different inflation rate from the announced one.
The highest reading of the entire series is January 1974: +33.6%, in the wake of the first oil crisis. This was followed by a whole period in which double-digit inflation was the norm — from 1973 to 1994, there was not a single year in which the average annual rate fell below 10%.
The peak of 2022 —+12.1% in June— it was the biggest shock of the last thirty years, but in historical terms it remains one-third of 1974. The difference is that 2022 found a society that had grown accustomed to two decades of stability.
There is a period where the white line actually curves downwards: from March 2013 to mid-2016 Greece was in deflation, with a low of −2.91 TP3T in November 2013. The 2016 price level was lower than that of 2012.
It was not, however, good news. The drop in prices occurred amid a deep recession, with shrinking incomes and demand. The only period in modern Greek history when things became cheaper is also the period when most people had less to spend.
The same chart in logarithmic scale It says something different, and it's worth a clarification. There, the vertical axis doesn't measure units but multiplications: the distance from 1 to 10 is the same as the distance from 10 to 100. That's why the grid lines go 1, 2, 5, 10, 20, 50 and not 25, 50, 75.
The gain is that the slope of the line stops showing how much prices have gone up and it shows how fast. The steeper it is, the greater the annual rate; a straight section means a constant percentage each year; a horizontal line means zero inflation. This way you can compare a decade where the index was at 2 with one where it is at 120 — something impossible on a linear scale, where the first one is stuck at zero.
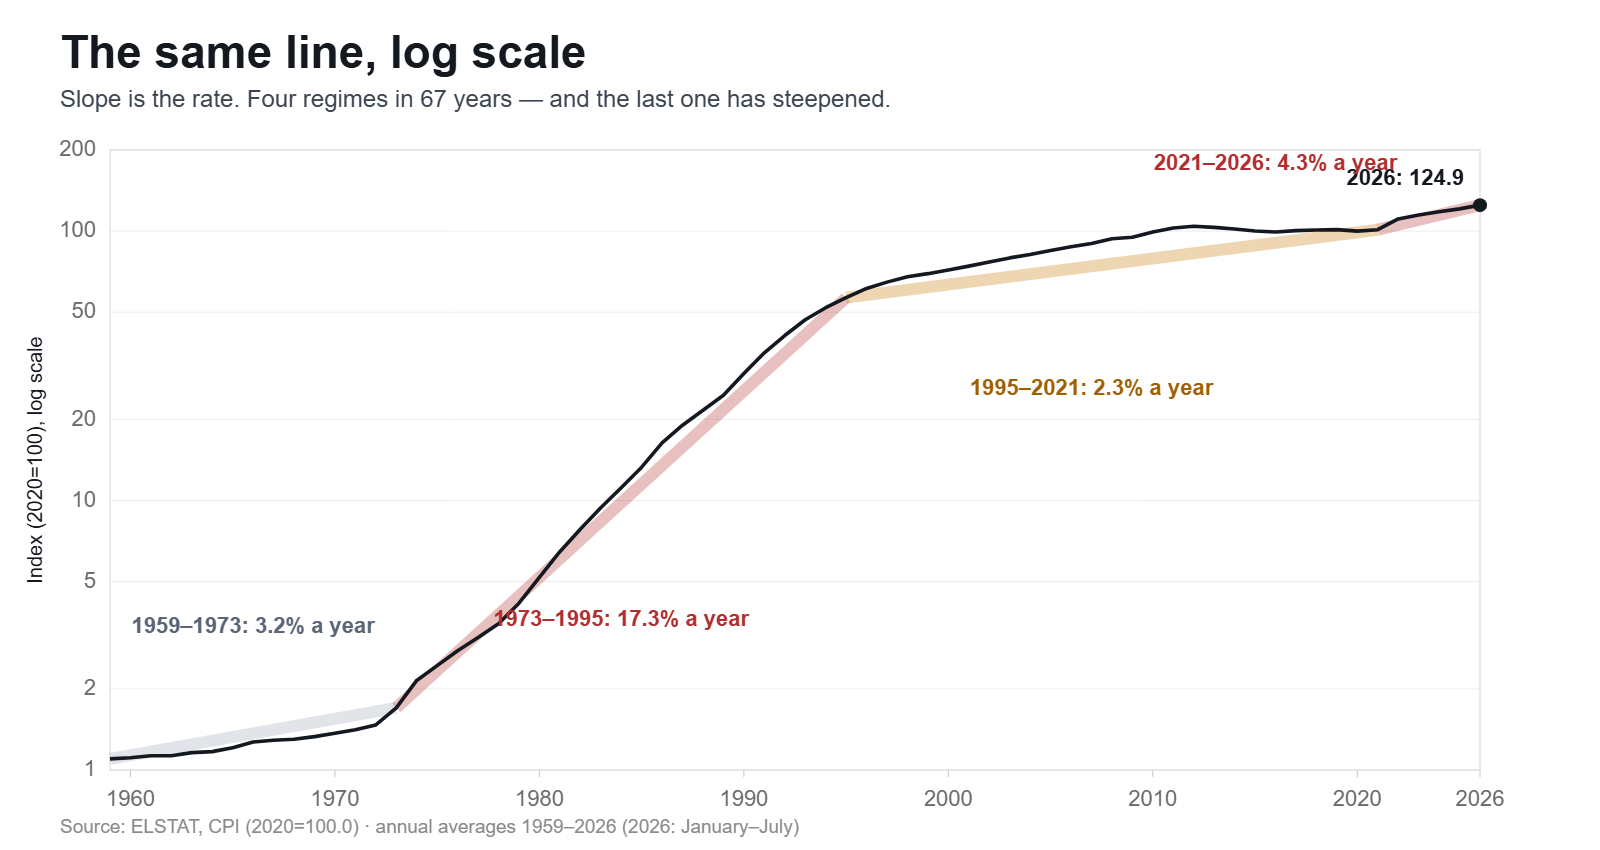
The final slope is also the most interesting. Since 2021 the index has been rising with 4.31 TP3T per year — almost double the rate of the 2.3% recorded over the twenty-five years of the euro, but also a long way from the 17.3% of the drachma. In other words, this is neither a return to normality nor a return to the 1980s. The line ceased to be vertical after the peak in 2022, but stabilised at a steeper slope than we had become accustomed to. If this trend continues, the price level will double to sixteen years instead of thirty.
Here, too, lies the answer to why the sense that everything has become expensive is not a subjective impression. Households' expectations of what something "should" cost were shaped over twenty-five years of 2.3% annual inflation, during which prices doubled every thirty years — that is, once in a working lifetime. Since 2021 the pace has nearly doubled. The gap between what one expects to see on the shelf and what one actually sees is not closing because inflation has returned to 3%; it closes only if incomes catch up with the new pace.
The decline from the 2022 peak was rapid and brought the rate down to an average of 2.5% in 2025. In 2026, however, the trend changed: 5.4% in April, with the average figure for the seven-month period from January to July standing at 3.9%, compared with 2.6% for the corresponding period in 2025. The latest available figure, for July, is 3.4%.
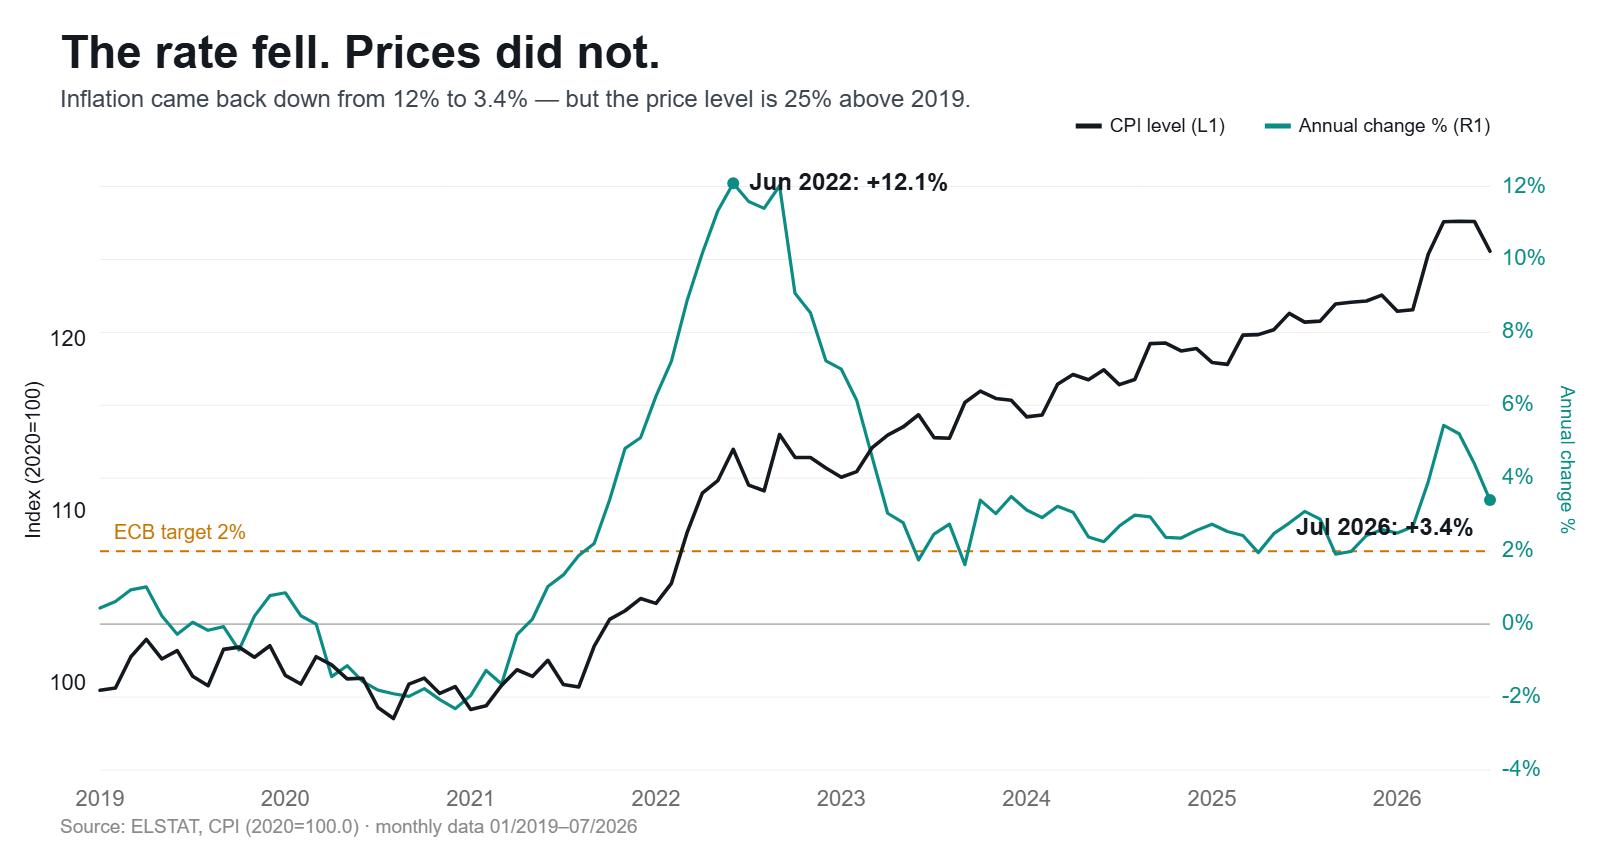
The graph shows both sides at the same time. The cyan line has returned to almost where it was in 2019; the white line, which measures the price level based on January of that year, stands at 125.6. The same basket has become a quarter more expensive in seven and a half years, and nothing on this line suggests a return.
The element is not enough to be characterised as a new inflationary wave. The critical question is whether the acceleration is due to energy and food — which subside on their own — or to core inflation, which does not subside. ELSTAT has been publishing a core index since 2009 and separate indices for goods and services; We will return to these details in a subsequent article, along with the comparison with the euro area, which shows whether inflation was imported or domestic.
The key conclusion is not a forecast but an interpretation. Even if inflation stabilises at 2%, the white line continues to rise — albeit more gradually. The sense that everything is expensive does not stem from the current rate but from the cumulative distance already covered, and that distance cannot be undone.
Two questions remain that the HICP on its own does not answer: whether the acceleration in 2026 came from outside or took root here, and who ultimately bore the difference. The first is judged by the core index and the comparison with the euro area. The second, by the wage data. Both have their own data — and their own articles.
Sources: ELSTAT, Consumer Price Index (2020=100.0), Tables IV and V, time series January 1959 – July 2026; ELSTAT, CPI Press Releases 2026. The data and correlations do not constitute investment advice.

Certified Technical Analyst (MSTA) and financial/sports writer with expertise in capital markets, trading systems and trading strategies.
Graduate of the Department of Statistics of the London School of Economics and Finance of ALBA Business School.


